Source code is uploaded on github.
CIFAR-10 and CIFAR-100 are the small image datasets with its classification labeled. It is widely used for easy image classification task/benchmark in research community.
- Official page: CIFAR-10 and CIFAR-100 datasets
In Chainer, CIFAR-10 and CIFAR-100 dataset can be obtained with build-in function.
Setup code:
from __future__ import print_function
import os
import matplotlib.pyplot as plt
%matplotlib inline

import numpy as np

import chainer

basedir = './src/cnn/images'
CIFAR-10
chainer.datasets.get_cifar10 method is prepared in Chainer to get CIFAR-10 dataset. Dataset is automatically downloaded from https://www.cs.toronto.edu only for the first time, and its cache is used from second time.
CIFAR10_LABELS_LIST = [
    'airplane',
    'automobile',
    'bird',
    'cat',
    'deer',
    'dog',
    'frog',
    'horse',
    'ship',
    'truck'
]

train, test = chainer.datasets.get_cifar10()
The dataset structure is quite same with MNIST dataset, it is TupleDataset.train[i] represents i-th data, there are 50000 training data.
test data structure is same, with 10000 test data.
print('len(train), type ', len(train), type(train))
print('len(test), type ', len(test), type(test))
len(train), type 50000 <class 'chainer.datasets.tuple_dataset.TupleDataset'>len(test), type 10000 <class 'chainer.datasets.tuple_dataset.TupleDataset'>
train[i] represents i-th data, type=tuple \( (x_i, y_i) \), where \(x_i\) is image data and \(y_i\) is label data.
train[i][0] represents \(x_i\), CIFAR-10 image data, this is 3 dimensional array, (3, 32, 32), which represents RGB channel, width 32 px, height 32 px respectively.
train[i][1] represents \(y_i\), the label of CIFAR-10 image data (scalar), this is scalar value whose actual label can be converted by LABELS_LIST.
Let’s see 0-th data, train[0], in detail.
print('train[0]', type(train[0]), len(train[0]))

x0, y0 = train[0]
print('train[0][0]', x0.shape, x0)
print('train[0][1]', y0.shape, y0, '->', CIFAR10_LABELS_LIST[y0])
train[0] <class 'tuple'> 2 train[0][0] (3, 32, 32) [[[ 0.23137257 0.16862746 0.19607845 ..., 0.61960787 0.59607846 0.58039218] [ 0.0627451 0. 0.07058824 ..., 0.48235297 0.4666667 0.4784314 ] [ 0.09803922 0.0627451 0.19215688 ..., 0.46274513 0.47058827 0.42745101] ..., [ 0.81568635 0.78823537 0.77647066 ..., 0.627451 0.21960786 0.20784315] [ 0.70588237 0.67843139 0.72941178 ..., 0.72156864 0.38039219 0.32549021] [ 0.69411767 0.65882355 0.7019608 ..., 0.84705889 0.59215689 0.48235297]] [[ 0.24313727 0.18039216 0.18823531 ..., 0.51764709 0.49019611 0.48627454] [ 0.07843138 0. 0.03137255 ..., 0.34509805 0.32549021 0.34117648] [ 0.09411766 0.02745098 0.10588236 ..., 0.32941177 0.32941177 0.28627452] ..., [ 0.66666669 0.60000002 0.63137257 ..., 0.52156866 0.12156864 0.13333334] [ 0.54509807 0.48235297 0.56470591 ..., 0.58039218 0.24313727 0.20784315] [ 0.56470591 0.50588238 0.55686277 ..., 0.72156864 0.46274513 0.36078432]] [[ 0.24705884 0.17647059 0.16862746 ..., 0.42352945 0.40000004 0.4039216 ] [ 0.07843138 0. 0. ..., 0.21568629 0.19607845 0.22352943] [ 0.08235294 0. 0.03137255 ..., 0.19607845 0.19607845 0.16470589] ..., [ 0.37647063 0.13333334 0.10196079 ..., 0.27450982 0.02745098 0.07843138] [ 0.37647063 0.16470589 0.11764707 ..., 0.36862746 0.13333334 0.13333334] [ 0.45490199 0.36862746 0.34117648 ..., 0.54901963 0.32941177 0.28235295]]]train[0][1] () 6 -> frog
def plot_cifar(filepath, data, row, col, scale=3., label_list=None):
    fig_width = data[0][0].shape[1] / 80 * row * scale
    fig_height = data[0][0].shape[2] / 80 * col * scale
    fig, axes = plt.subplots(row,
                             col,
                             figsize=(fig_height, fig_width))
    for i in range(row * col):
        # train[i][0] is i-th image data with size 32x32
        image, label_index = data[i]
        image = image.transpose(1, 2, 0)
        r, c = divmod(i, col)
        axes[r][c].imshow(image)  # cmap='gray' is for black and white picture.
        if label_list is None:
            axes[r][c].set_title('label {}'.format(label_index))
        else:
            axes[r][c].set_title('{}: {}'.format(label_index, label_list[label_index]))
        axes[r][c].axis('off')  # do not show axis value
    plt.tight_layout()   # automatic padding between subplots
    plt.savefig(filepath)
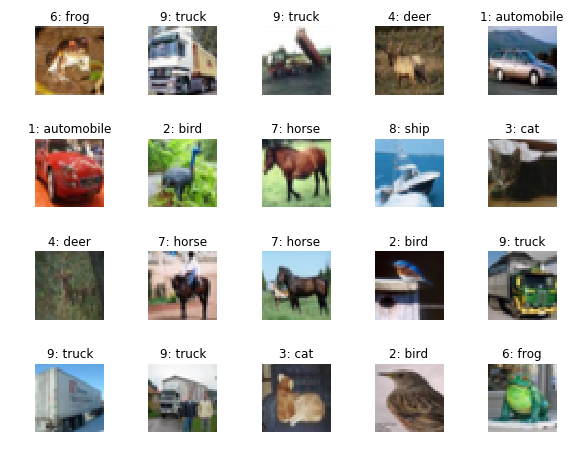
plot_cifar(os.path.join(basedir, 'cifar10_plot.png'), train, 4, 5,
scale=4., label_list=CIFAR10_LABELS_LIST)
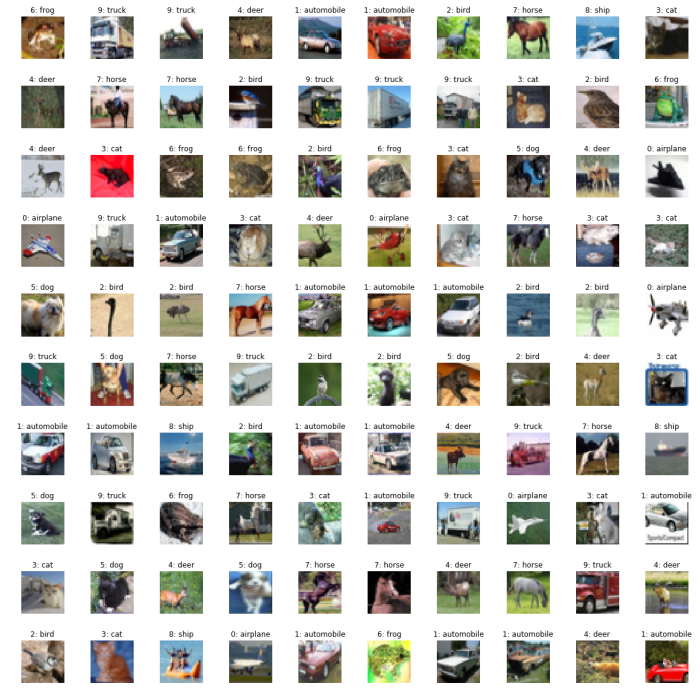
plot_cifar(os.path.join(basedir, 'cifar10_plot_more.png'), train, 10, 10,
scale=4., label_list=CIFAR10_LABELS_LIST)
CIFAR-100
CIFAR-100 is really similar to CIFAR-10. The difference is the number of classified label is 100. chainer.datasets.get_cifar100 method is prepared in Chainer to get CIFAR-100 dataset.
CIFAR100_LABELS_LIST = [
    'apple', 'aquarium_fish', 'baby', 'bear', 'beaver', 'bed', 'bee', 'beetle',
    'bicycle', 'bottle', 'bowl', 'boy', 'bridge', 'bus', 'butterfly', 'camel',
    'can', 'castle', 'caterpillar', 'cattle', 'chair', 'chimpanzee', 'clock',
    'cloud', 'cockroach', 'couch', 'crab', 'crocodile', 'cup', 'dinosaur',
    'dolphin', 'elephant', 'flatfish', 'forest', 'fox', 'girl', 'hamster',
    'house', 'kangaroo', 'keyboard', 'lamp', 'lawn_mower', 'leopard', 'lion',
    'lizard', 'lobster', 'man', 'maple_tree', 'motorcycle', 'mountain', 'mouse',
    'mushroom', 'oak_tree', 'orange', 'orchid', 'otter', 'palm_tree', 'pear',
    'pickup_truck', 'pine_tree', 'plain', 'plate', 'poppy', 'porcupine',
    'possum', 'rabbit', 'raccoon', 'ray', 'road', 'rocket', 'rose',
    'sea', 'seal', 'shark', 'shrew', 'skunk', 'skyscraper', 'snail', 'snake',
    'spider', 'squirrel', 'streetcar', 'sunflower', 'sweet_pepper', 'table',
    'tank', 'telephone', 'television', 'tiger', 'tractor', 'train', 'trout',
    'tulip', 'turtle', 'wardrobe', 'whale', 'willow_tree', 'wolf', 'woman',
    'worm'
]

train_cifar100, test_cifar100 = chainer.datasets.get_cifar100()
The dataset structure is quite same with MNIST dataset, it is TupleDataset.
train[i] represents i-th data, there are 50000 training data. Total train data is same size while the number of class label increased. So the training data for each class label is fewer than CIFAR-10 dataset.
test data structure is same, with 10000 test data.
print('len(train_cifar100), type ', len(train_cifar100), type(train_cifar100))
print('len(test_cifar100), type ', len(test_cifar100), type(test_cifar100))

print('train_cifar100[0]', type(train_cifar100[0]), len(train_cifar100[0]))

x0, y0 = train_cifar100[0]
print('train_cifar100[0][0]', x0.shape)  # , x0
print('train_cifar100[0][1]', y0.shape, y0)
len(train_cifar100), type 50000 <class 'chainer.datasets.tuple_dataset.TupleDataset'>len(test_cifar100), type 10000 <class 'chainer.datasets.tuple_dataset.TupleDataset'>train_cifar100[0] <class 'tuple'> 2train_cifar100[0][0] (3, 32, 32)train_cifar100[0][1] () 19
plot_cifar(os.path.join(basedir, 'cifar100_plot_more.png'), train_cifar100,
           10, 10, scale=4., label_list=CIFAR100_LABELS_LIST)
Next: CIFAR-10, CIFAR-100 training with Convolutional Neural Network